Exciting news! Based on your feedback, we've created our own in-house Dashboard for tracking all Attendee analytics for your event. You can still connect Google Analytics if you'd like, but it is not necessary.
To access this Dashboard, log in to your Event Organizer account. From there, you'll want to access your Virtual Event by choosing "Manage Submissions" from the drop-down menu in the top right corner of the screen. Once you're on the Submissions Dashboard, click the button which reads "Manage Virtual Event."
At the top of the page, you should see the bar that allows you to switch between Edit Mode, Attendee View, etc. We have added a new link to "Analytics Dashboard." Click here.

Additionally, you can always just use the direct link to your Dashboard, which will be of the form https://www.eventhub.shop/analytics/YOUR-EVENT-NAME.
Overall Dashboard
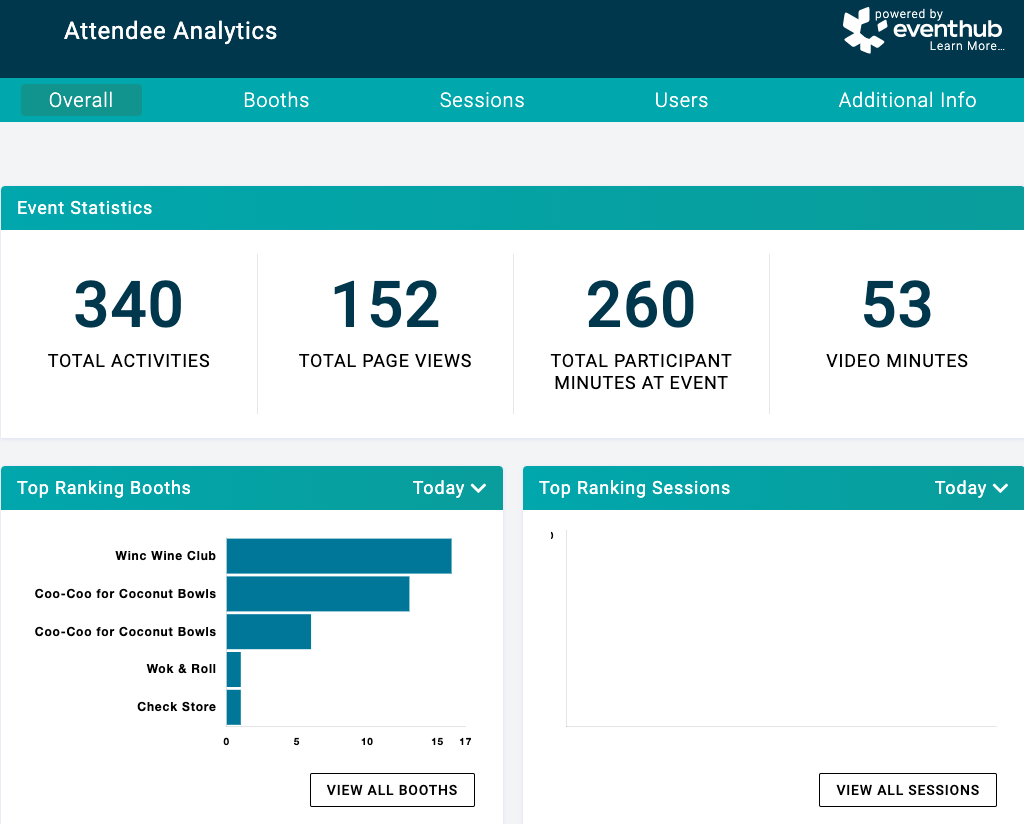
The analytics landing page will look something like this:

At the top of this page, we have Key Performance metrics with Total Activities (any form of interaction on any page), Total Page Views, Total Participant Minutes At Event (time they spent on your pages), and Video Minutes (time they spent watching videos on your event pages).
Below this, we have Top Ranking Booths and Sessions. These graphs show Booths and Sessions ranked by their unique visits from attendees. You can see in the upper right corner of each of these that the default is for "Today," but if you click on this dropdown, you can select any date you'd like to look at how booths and sessions ranked on any give day.
The next section shows what devices Devices Used and Marketing Channels:

This is a great place to see what devices your attendees are using, and where they found the link to your site. Here you can find out if Facebook is driving all your traffic and you want to double-down there, or maybe your Twitter promotion needs a boost.
Booths Dashboard
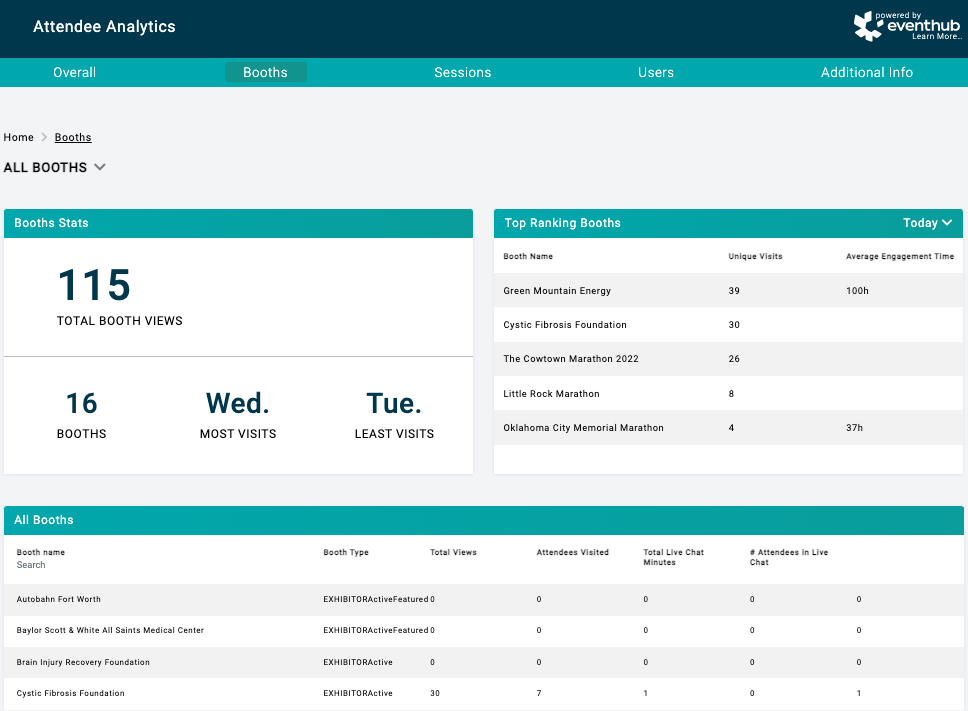
From the Overall page, you can dive into Booth-specific analytics by clicking either the VIEW ALL BOOTHS button in the Top Ranking Booths chart or click into the Booths tab at the top of the page. Then you will be brought here:

To learn more about a specific booth, you can search for it under "All Booths" or click its row in any of these charts.

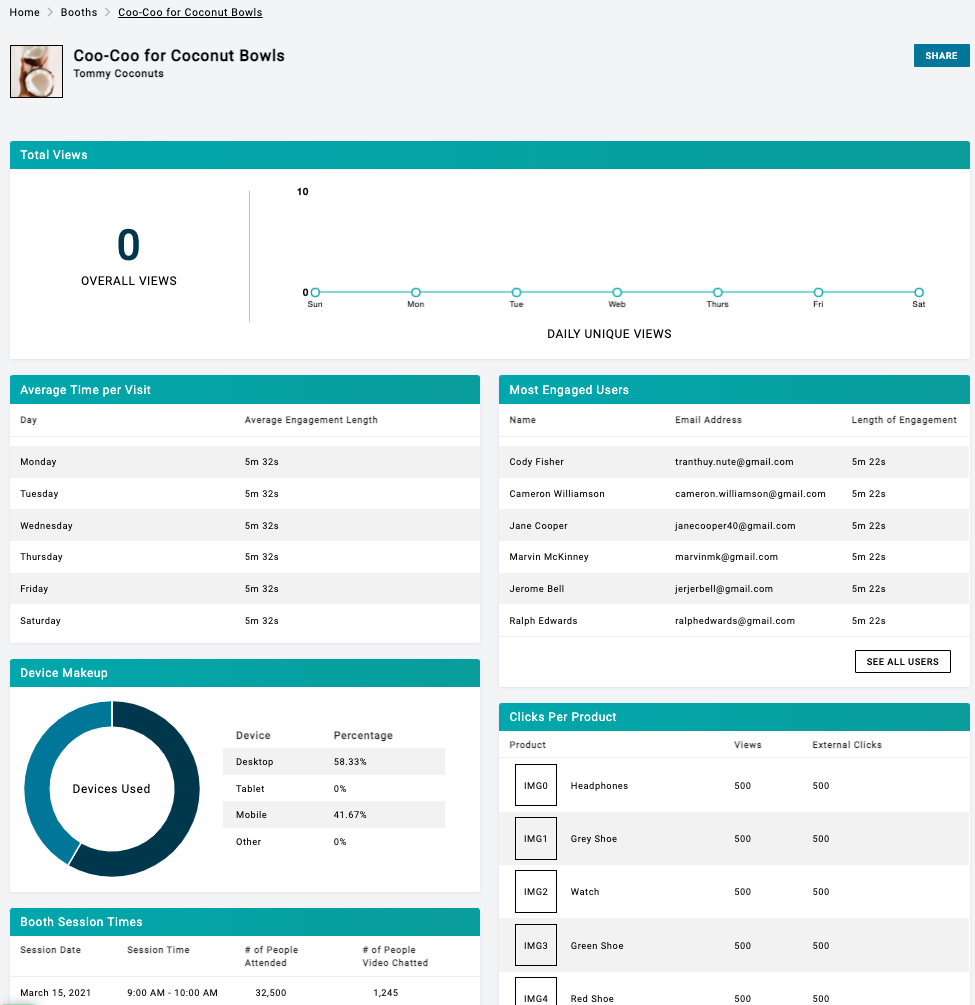
Here, you can dive into to everything that happened on a specific Booth page. This includes number of views, average time per visit, what devices the attendees were on, a list of most engaged users, and clicks per product.
For the Total Views section at the top, those two numbers are not related. Overall Views is the total views over all time, and these are not unique. So this means the total number of times anyone has ever viewed your page, since the time it was first available online. A visitor who has been there more than once will have all their views counted in this number. The chart, however, represents daily unique views over just the last 7 days. So this means that if "daily unique views" was only 1 for a certain day, there was only 1 visitor, though they could have viewed your page multiple times.
You can even export all the attendees who attended a certain booth, along with their emails!
*CURRENTLY UNAVAILABLE* Sessions Dashboard
Stay tuned for updates
From the Overall page, you can dive into Booth-specific analytics by clicking either the VIEW ALL SESSIONS button in the Top Ranking Sessions chart or click into the Booths tab at the top of the page.
Here you can find things like total number of visits to a session, engagement time, number people who added the event to their calendar, and more!
To learn more about a specific session, you can search for it under "All Sessions" or click its row in any of these charts.
Users Dashboard
This will show you overall Attendee statistics, as well as give you the ability to delve into each user and see what sort of actions they took and where they spent their time. This includes seeing the number of booths an individual visited, number of engagement events, etc.


Comments
0 comments
Please sign in to leave a comment.